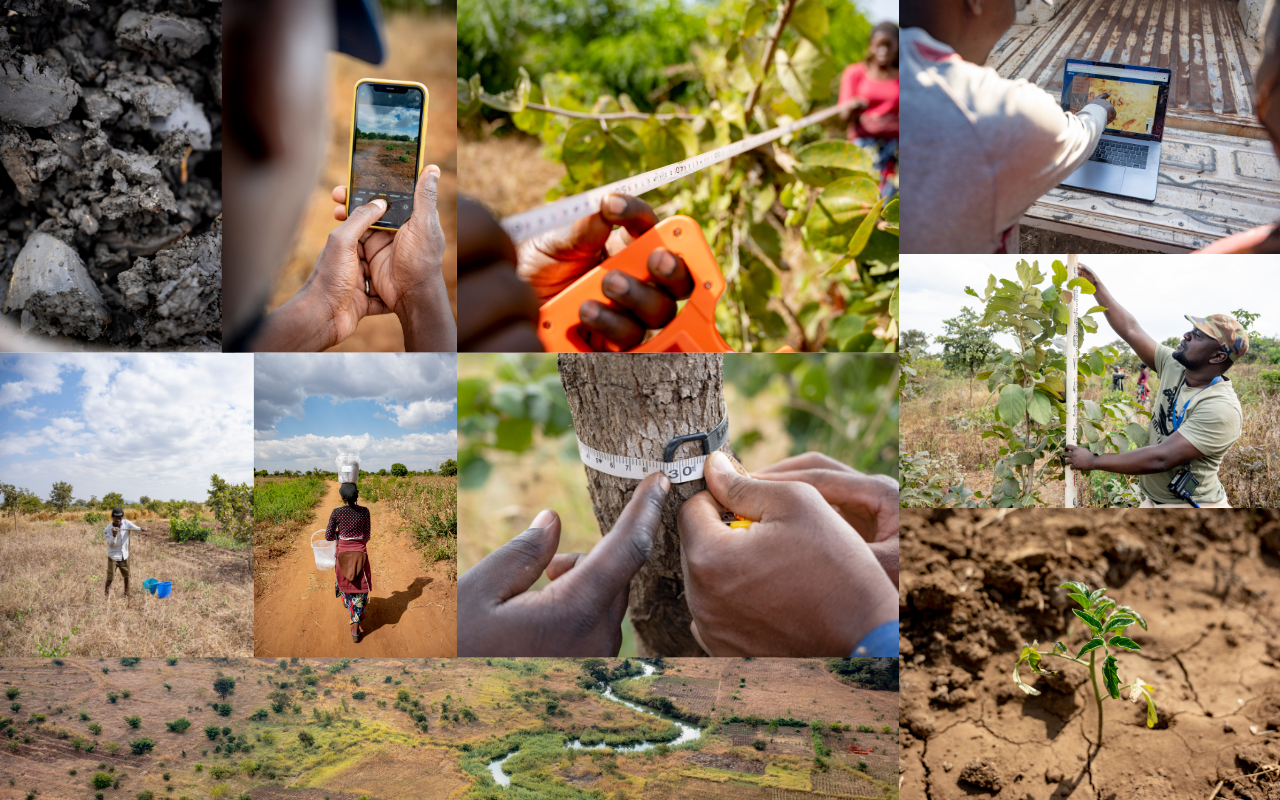
LDSF sites
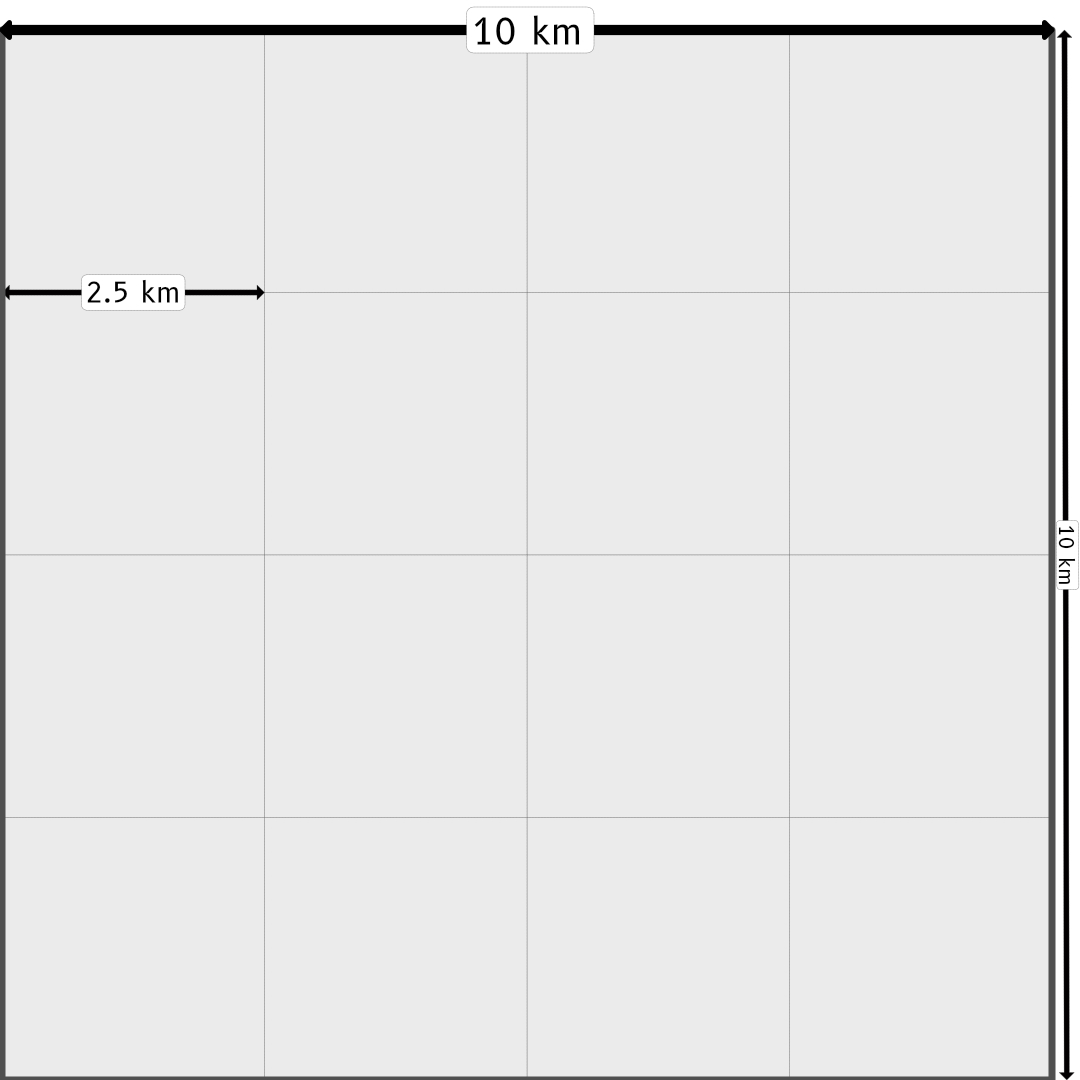
In its standard form, the LDSF consists of sites that each cover a 10km x 10km area or landscape. Each site is stratified into 16 tiles 2.5km x 2.5km in size (Figure 1).
This stratification is designed to ensure that the field data collection is not biased and that it is representative of the landscape being surveyed and sampled. It has been shown to work well in a variety of landscapes and ecosystems, including savannas, woodlands, and forests.
However, it is also possible to use other stratification schemes depending on the specific objectives of a survey or project as long as the LDSF clustered sampling design is maintained (see below).

clusters and plots
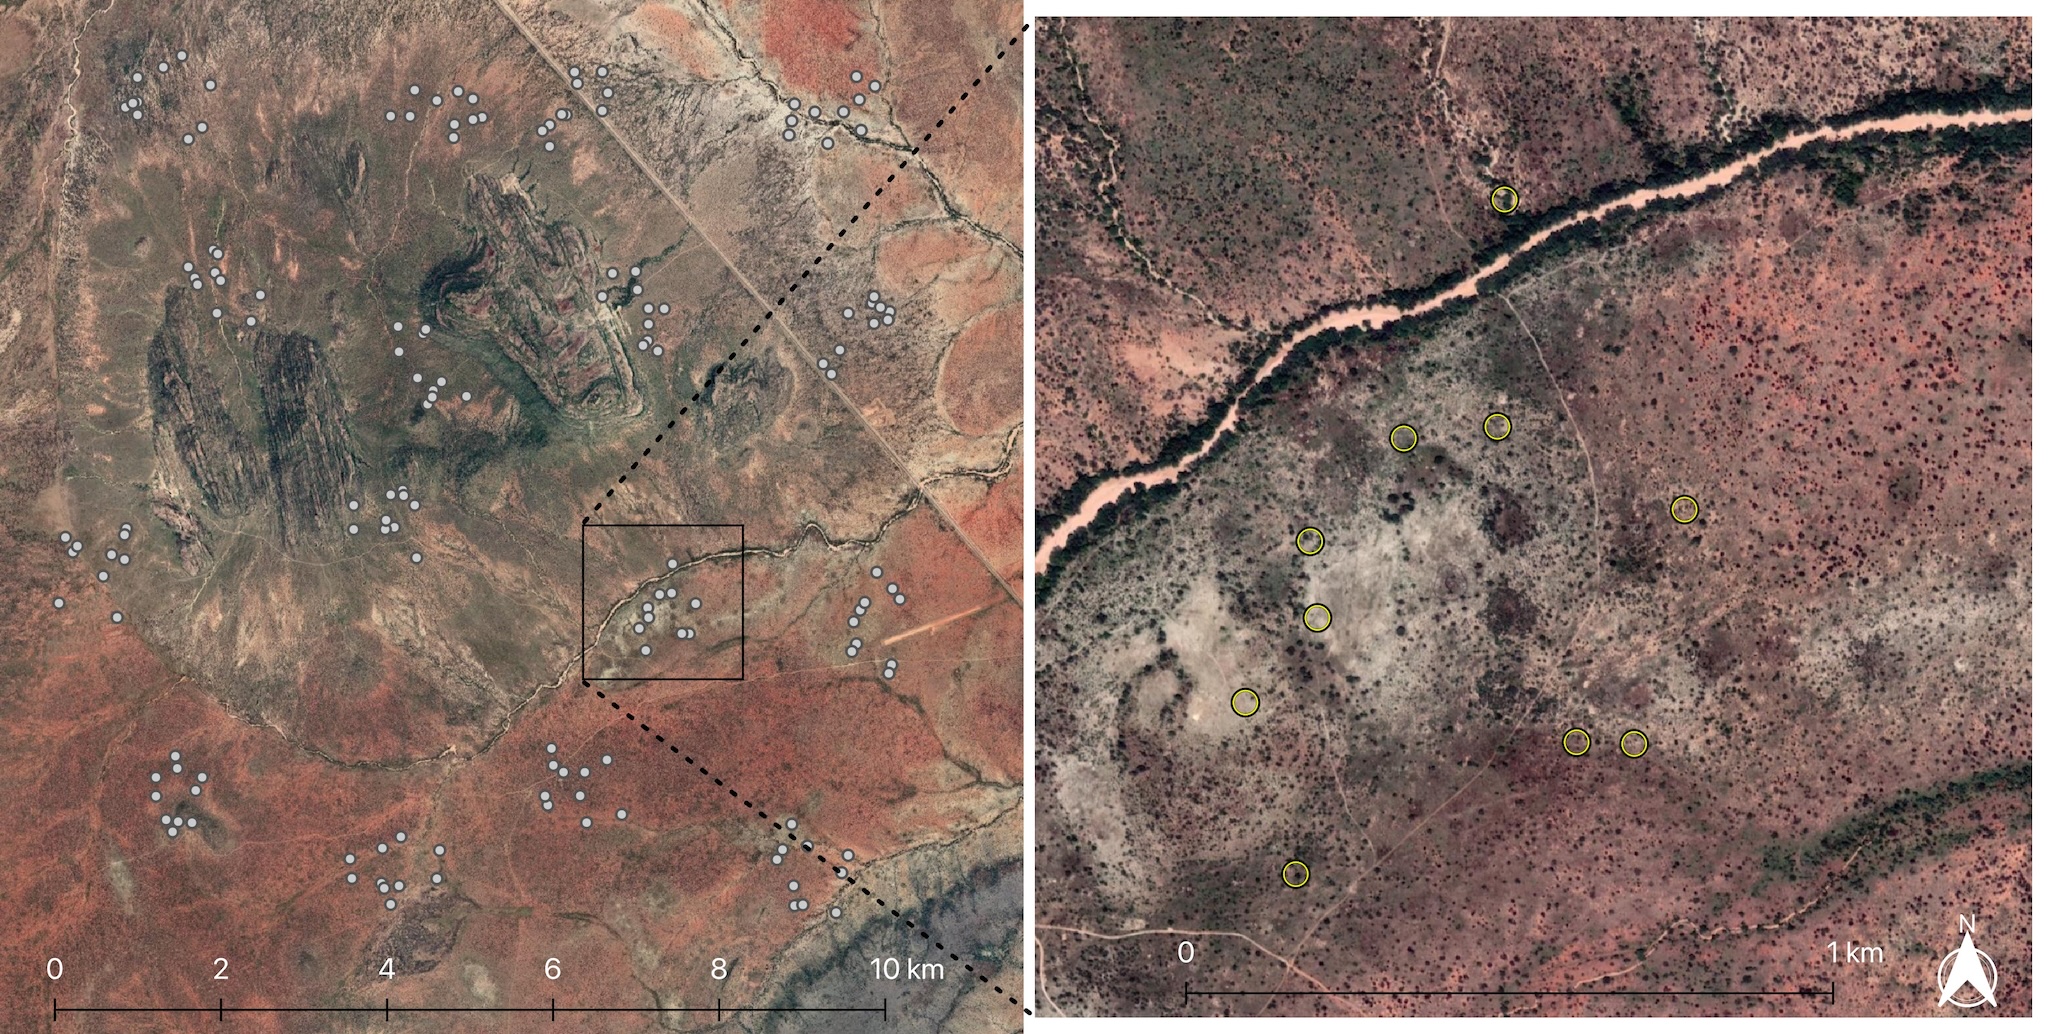
In the LDSF the primary sampling unit is the cluster. The clusters are generated using a two-stage stratification process where cluster centroids (center points) are first randomised within each of the 16 tiles shown in Figure 1 and sampling plots are then randomized within a 1 km2 area around each centroid. The result is a LDSF site with 16 clusters. As mentioned, other stratificaton schemes can be used, but the clustered sampling design must be maintained.
Within each cluster, 10 sampling plots are randomized (Figure 2). In other words, 160 sampling plots are surveyed and sampled per LDSF site.
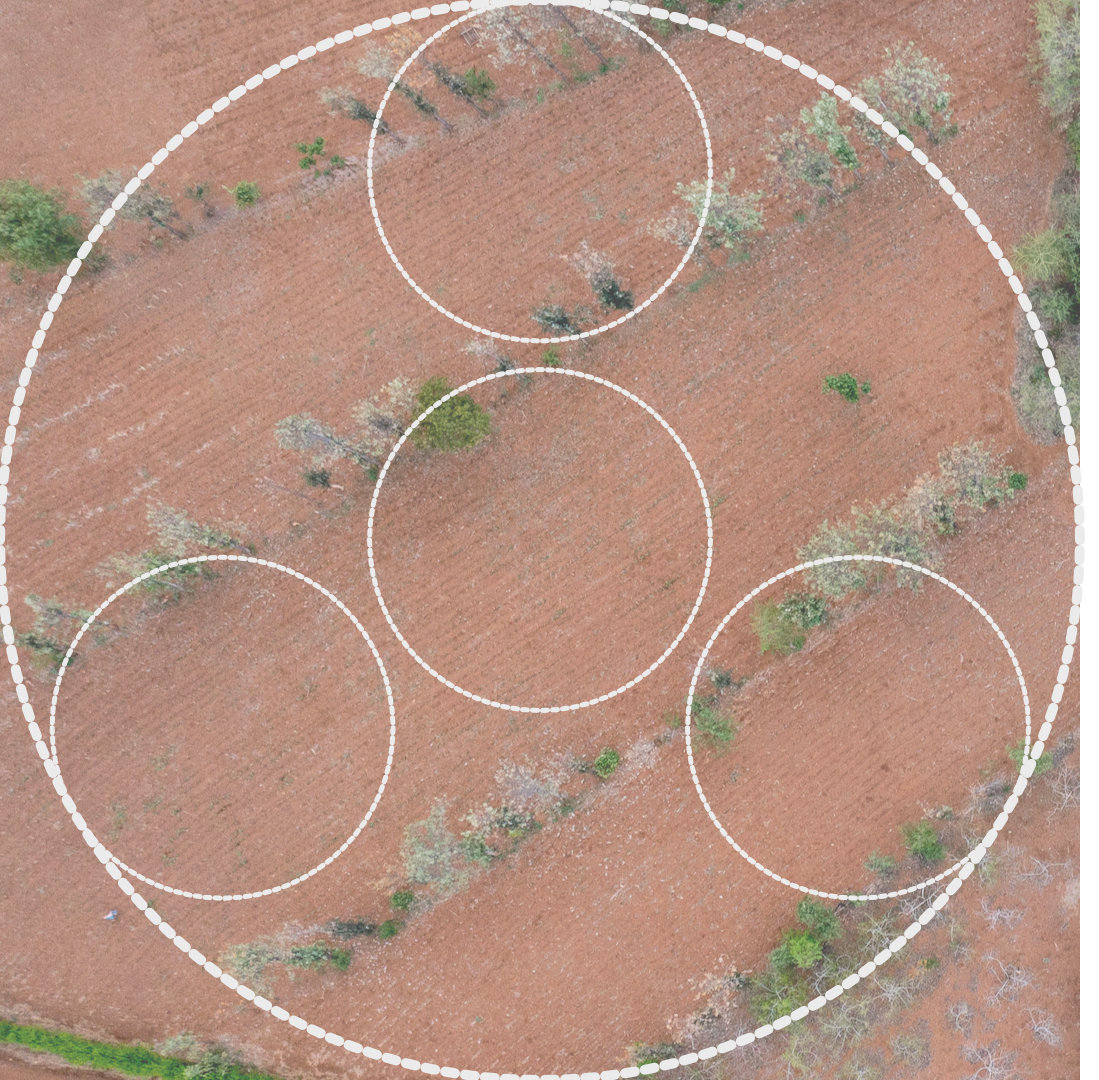
Each LDSF sampling plot is 1,000 m2 in size (Figure 3). Within LDSF plots, land use is recorded, presence/absence of trees and shrubs are captured, and the plot is classified according to vegetation structure class as described on the LDSF indicators page.
Within each plot there are 4 subplots that are located as illustrated in Figure 3, each 100 m2. Here, detailed data on trees and shrubs are made and visible soil erosion is recorded. Also, soil samples are collected for each subplot, both in the upper 20cm of the soil (topsoil) and between 20 and 50cm (subsoil). These samples are composited mixed to form a single sample for each plot and depth increment.


